Table Of Contents
The Power Trio Driving Smarter Decisions
Introcing Laurent
Good morning!
I'm Laurent, Wakeflow's new Director of Growth. After 15+ years navigating corporate mazes at Accenture and Cisco across the U.S. and Europe, I've landed where I belong - helping scale a nimble and ambitious software development firm.
Every 10 days, I'll drop something useful in your inbox. Think: sharp how-to guides, a peek under the hood of tools we've built, or quick takes on topics that help your business grow smarter, not harder. Not interested? Unsubscribe here.
The Power Trio
Today we'll explore: the Power Trio Driving Smarter Decisions - Data Automation, Reporting, and Visualization.
In today's data-saturated world, manual work just can't keep up. Data automation is now essential - not just for efficiency, but for accuracy and speed. According to a 2023 McKinsey study, organizations using automation tools can slash data processing times by up to 80%. That's not just time saved, it's a competitive edge gained.
We're seeing a clear trend:
➡️ Automate how data is collected, cleaned, and centralized.
➡️ Report on what matters, without drowning in noise.
➡️ Visualize insights so they're not just understood, they drive action.
The right tech stack should feel like a superpower. When automation hums in the background and insights are effortless to share, teams can move faster and make smarter decisions together. These days we're seeing SaaS platforms (e.g. Salesforce) offer automation capabilities - the down side to this is that these usually tie you further into their own ecosystem. So what do we recommend? Write your own code, or hire a part-time developer to do this for you quickly and cheaply, and integrate it into the SaaS platform of your choice. This is easy to achieve, gives you the most flexibility, and allows it to auto-scale based on your needs.
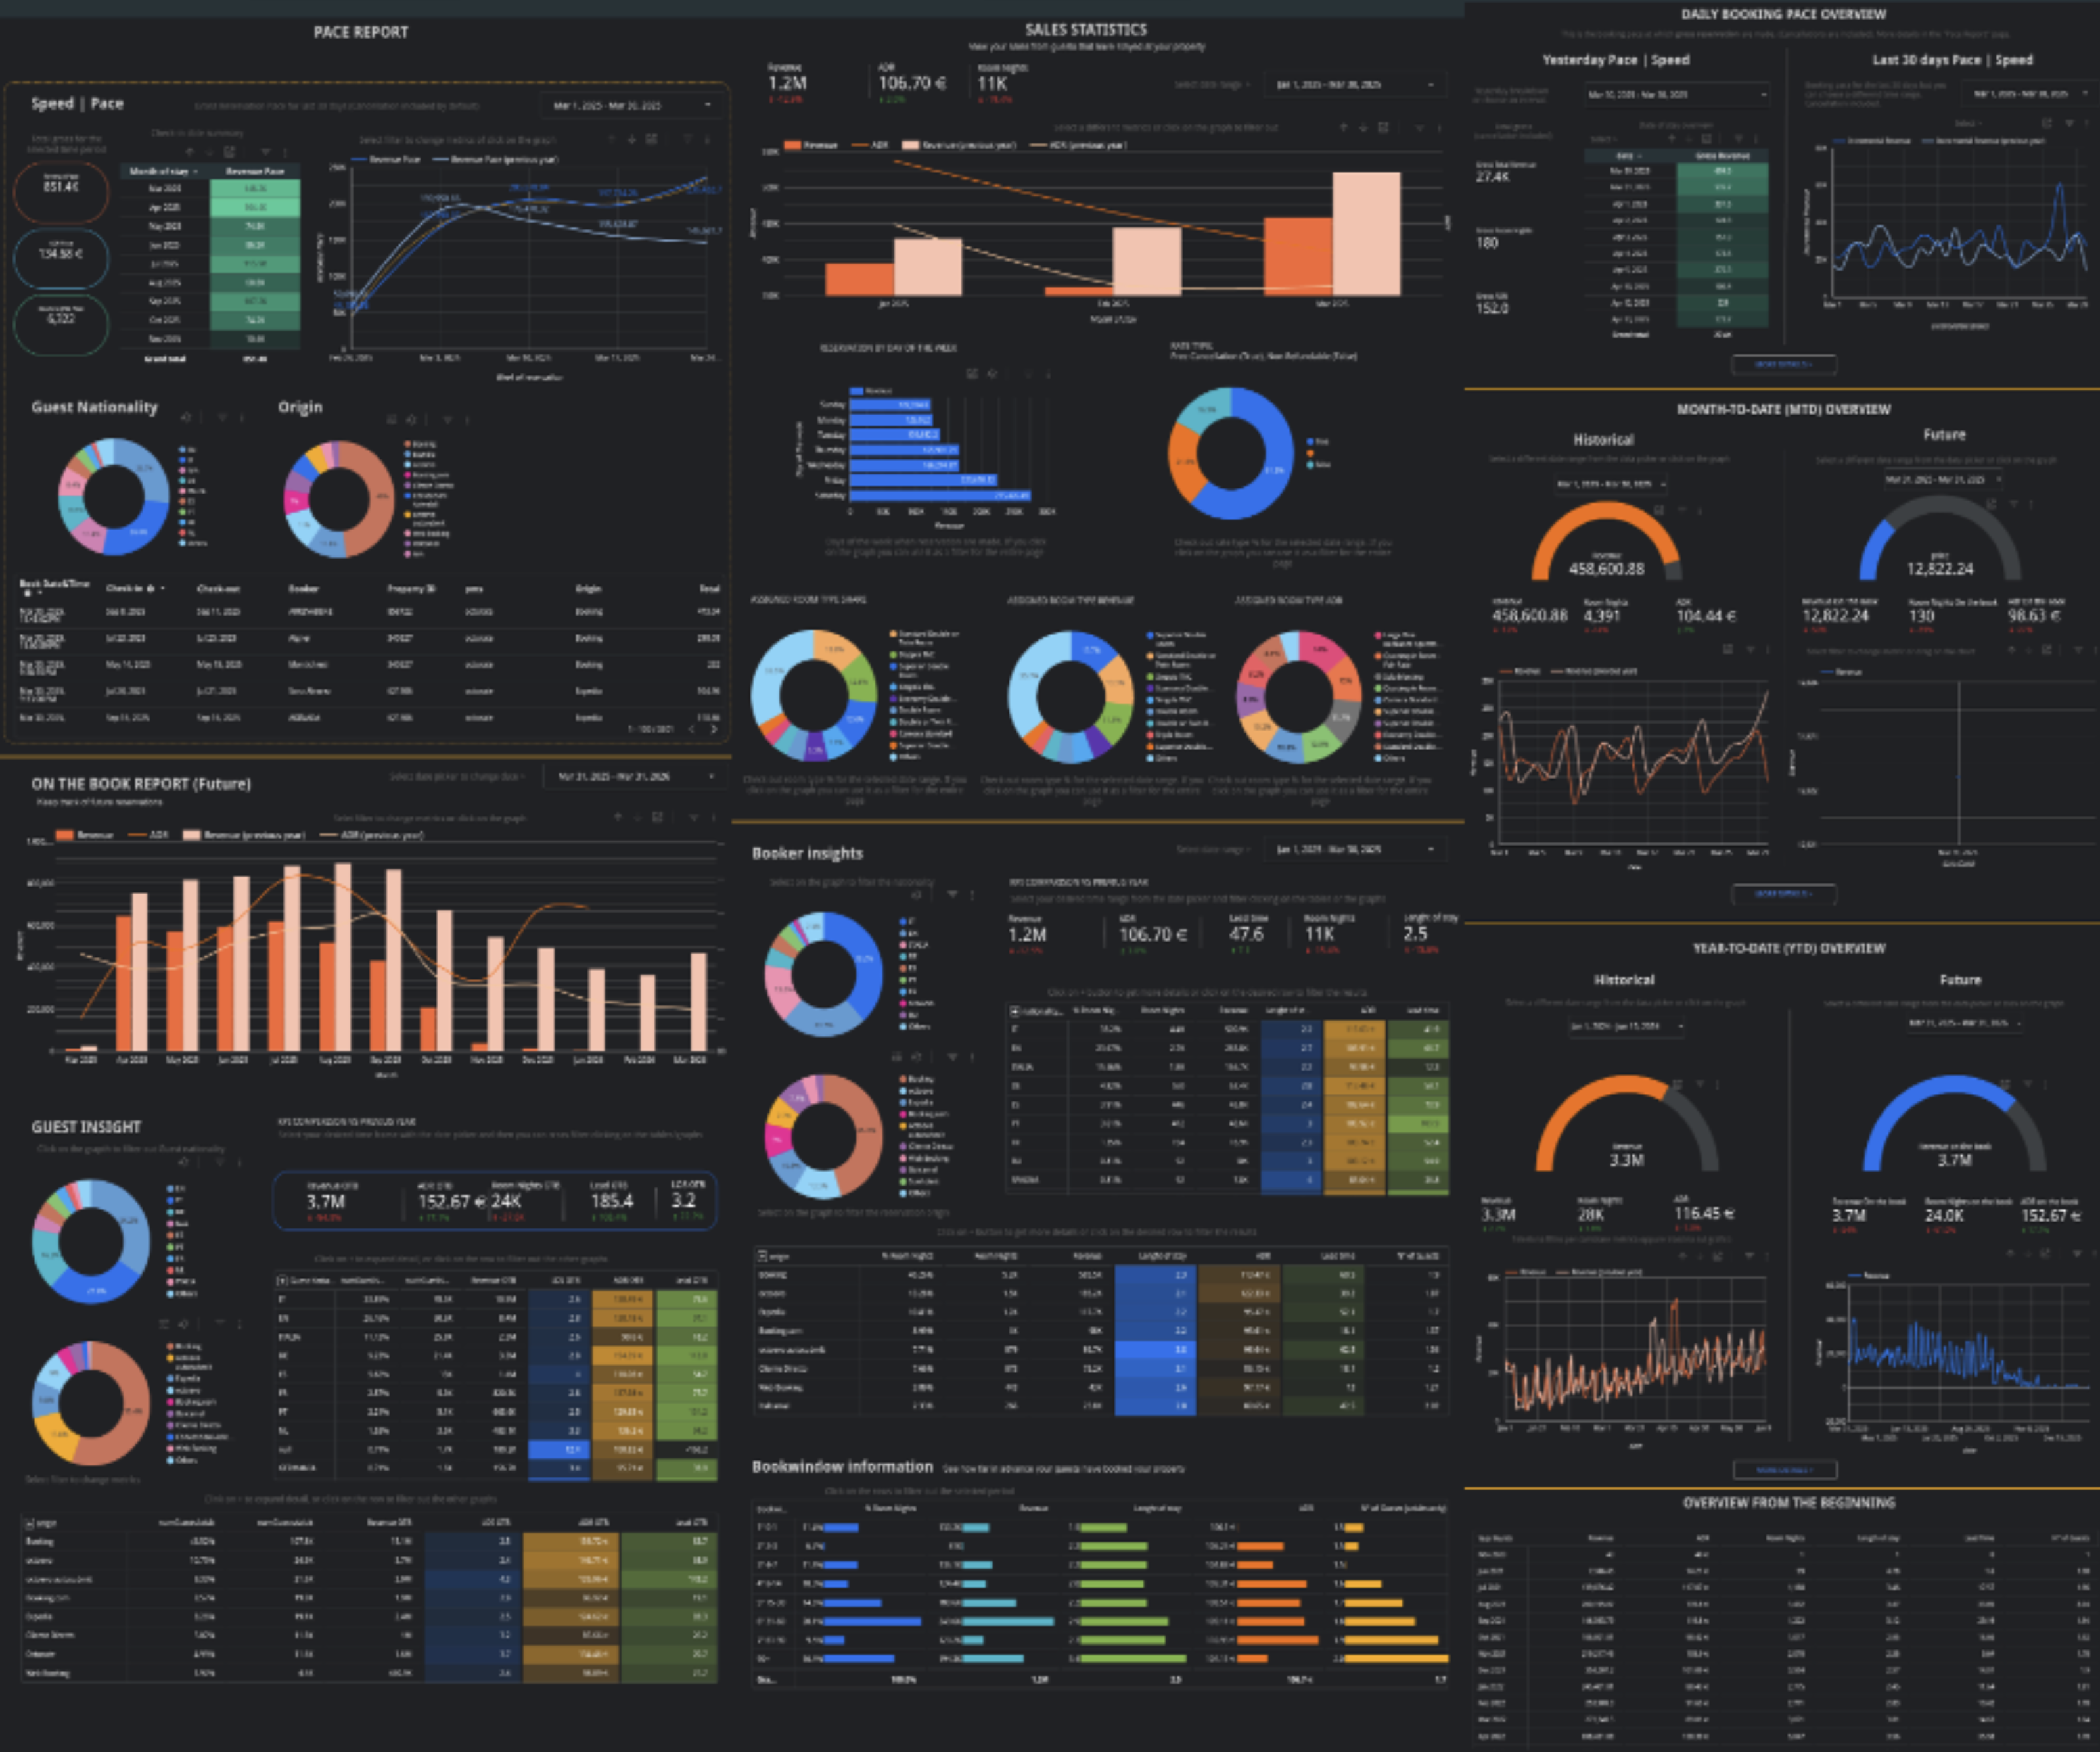
View of a custom dashboard using Looker Studio
The Benefits
Once your data workflows are automated, reporting and visualization take center stage as the way insights are delivered. Many companies default to using PowerBI or Tableau—and while it's powerful, it often brings its own headaches: slow data retrieval, clunky visuals, and painful export or sharing processes. Sound familiar? That's why we've come to appreciate other tools that actually solve these problems. Looker Studio, a free tool, is the new kid on the block that we've come to love. It's fast, provides digestible visualisations, and is easy to integrate with your tech stack. Because let's be honest: everyone breathes easier when the right insights reach the right people, clearly and quickly.
That's a wrap for today. Want more? Explore other articles from our team or swing by our site to see what we're building.
Scale wisely,
Laurent